Introduction
Cannabis
sativa is an ancient
plant with quite global distribution and multiple uses (El Sohly et al., 2017). The plant is native to East Asia
(De Backer et al., 2009). Cannabis phenotypes are highly variable and it is accepted that the plant has two subspecies: C. sativa subsp. sativa and
subsp. indica (Hillig y Mahlberg 2004; Knight et al., 2010). Increased
production of cannabis for medical and recreational purposes in recent years has led to a corresponding increase in laboratories performing cannabinoid analysis of cannabis and
hemp (McRae y Melanson 2020).
Natural cannabinoids exhibit
a terpenophenolic base structure (C21), and are constituted
by a group of approximately 120 compounds discovered to date (Radwan et al.,
2021). Among them, the metabolites cannabidiol and tetrahydrocannabinol are of particular importance due to the growing interest in developing consumer
products containing these compounds
(Persia et al., 2023). The concentration of each of these cannabinoids is
intrinsically related to the variety
(Aizpurua-Olaizola et al., 2014; Deidda et al., 2019). In industry, those
varieties with lower THC content are used
for the production of hemp fibers, cannabis oil (Glivar
et al., 2020). For veterinary supplements, low tetrahydrocannabinol content varieties
of C. sativa are employed (Pinto y Requicha, 2024). To date, there are more products
in which cannabinoids are present, such as
cosmetics, nutritional supplements (Kanabus et al., 2021). In certain cases,
THC and CBD are active ingredients (Wakshlag et al., 2020; Vasantha Rupasinghe et al., 2020).
In Paraguay, in 2020,
the National Program for the Promotion, Development, Cultivation, Development
of Production, Marketing and Research of Hemp and Industrial Hemp Cultivation
was created. Paraguay exported, for the first time in its history, 20 tons of
food derived from industrial hemp to the European Union in July of 2021, thus
becoming the first country in Latin America to export food derived from Cannabis
spp (Ferrere Legal Services, 2021). Currently, more than 700 peasant family
farmers work and plant hemp throughout the country, which could be an emerging
income category for small producers (La Nación, 2021).
According to Paraguayan legislation, industrial
hemp or non-psychoactive Cannabis is that which “plants flowering tops with or
without fruit, of the hemp plant, whatever its name, whose THC content is less
than 0.5%. dry weight of THC” Decree No. 2,725/19 Presidency of the Republic of
Paraguay. Although, within the changes in Paraguayan legislation (Decreto
2725/19, 2020), certain regulations have been established that include both the
production and research of products based on Cannabis sativa
and its derivatives, the current regulations do not contemplate or establish
any standardized regulatory protocol for the quantification of cannabinoids
within the national territory, which is crucial given the psychoactive
principle (THC) that can be found in greater or lesser concentration depending
on the variety of Cannabis
sativa with which one works. To our knowledge, there
are no studies or bibliographies that support cannabinoid quantification issues
at a national level. Based on these points, it is important to have a validated
quantification method to apply to C. sativa products. The objective of
this work was to develop a methodology for the quantification of cannabidiol
and tetrahydrocannabinol using high-performance liquid chromatography with emphasis
on optimal chromatographic conditions for quantitative analysis.
Materials and methods
Place of experimentation
The
present research was carried out at the Multidisciplinary Center for
Technological Research (CEMIT), located at the University Campus of the
National University of Asuncion in the city of San Lorenzo.
Standardization of the
method
As
a starting point for HPLC standardization, the experimental conditions proposed
by a Doehlert design generated by the Modde®10 software were used, with standard
reagents for the CBD and THC metabolites (Deidda et
al., 2019).
Variables studied
For the analysis
of the influence of each of the variables in the chromatographic separation
process, runs were performed modifying only the variable under study such as
Wavelength; Temperature; pH; Flow. The concentration of the CBD and THC
compounds was kept constant. The magnitude of the variable for which the
detector quantified the largest area was determined.
1. Wavelength
In order to evaluate the
impact of the wavelength variation in the detection process, runs were
performed at different wavelengths keeping constant the conditions of
temperature, elution flow, pH and concentration of the cannabinoids. As a
starting point, the wavelength proposed by Deidda et al. (2019) of 222 nm was
used and then modifications were made by varying the wavelengths between 200
and 222 nm for both the CBD and THC standards.
2. Temperature
Temperature
adjustments were made keeping constant the values of flux, wavelength and pH of
the mobile phase. The starting temperature was 53 ºC proposed by Deidda et al.
(2019) and in successive injections, the temperature values were modified
around the one proposed by the literature for subsequent analysis evaluating
its influence on both the peak area and retention time for the compounds
analyzed in the work.
3. pH evaluation
The
pH of the mobile phase (acetonitrile and dipotassium phosphate) was the variable
that was modified during the test, keeping the other chromatographic variables
(temperature, elution flow rate and wavelength) constant. For this, we started
from a pH equal to 3.45 proposed by Deidda et al (2019) and then with
injections of the mobile phase brought to a pH of 3.15 and subsequent
injections of the mixture with a pH corrected equal to 3.60.
4. Flow rate
The
flow rate was evaluated by modifying it in different injections, keeping
constant the values of temperature, pH of the mobile phase and wavelength in
each of the runs for the study of this parameter. We worked under isocratic
elution conditions with flow rates from 0.4 mL of mobile phase per minute
(mL/m) to 1.3 mL/m.
Data processing
and statistical analysis
To obtain the data and integrate the peaks, the Lab Solutions
software of the SHIMADZU corporation was used in its version for LC
chromatographs and the data were subsequently processed and analyzed with the
Microsoft Excel program of the Office 365 package version 2021 (SHIMADZU Corporación,
2021; Microsoft Office 365, 2021). A Regression and Linear
Correlation statistical treatment was performed on the data collected from all
the chromatographic runs. Once the chromatographic conditions
were standardized, the 5-point calibration curve was constructed. Five
dilutions of decreasing concentration were injected for both the CBD standard
and the THC standard. Using the Microsoft Excel program, a table of area as a
function of concentration was constructed for the metabolites studied, the
concentration being the independent variable and the area of the peak the
dependent variable directly proportional to the concentration of the analyte.
Procedural
part
a. Preparation
of the standards
From
certified standard solutions (SIGMA-ALDRICH®) six dilutions of decreasing
concentration of the working standards for the CBD and THC metabolites of
concentrations 1.03 mg/mL and 1.02 mg/mL, respectively, were prepared. Methanol
grade HPLC was used as a solvent to prepare dilutions.
b. Preparation
of the mobile phase 75:25
The
mobile phase was made for a mixture of HPLC grade acetonitrile (J.T. Baker®)
and a dipotassium phosphate solution (MERCK pro analysis). For the preparation
of the phosphate solution, the necessary grams were weighed on an analytical
balance to obtain a concentration of 5 mM of the salt in the final volume of
the mobile phase mixture, which were dissolved in deionized water with the help
of a glass rod until the total dissolution of the solute was visualized. The
acetonitrile was then mixed with the phosphate solution at a volume ratio of
75:25 (ACN:phosphate). The obtained mixture was brought to pH 3.45 with
appropriate volumes of 12 M HCl and once the pH was reached, the obtained
mixture was filtered with a vacuum filtration equipment using a membrane with a
pore size of 0.45 µm (MF- Millipore®MembraneFilter) and then sonicated for 15
minutes.
c. Chromatographic
conditions
The
equipment and reagents provided by the Multidisciplinary Center for
Technological Research were used. The High-Performance Liquid Chromatography
(HPLC) equipment used throughout the process was composed of a SHIMAZDU brand
chromatograph and a 250 mm long x 4.6 mm RESTEK brand C18 column. Both the CBD
and THC standards and their respective dilutions were injected into the
chromatography equipment of the CEMIT Medicines Quality Control Laboratory with
the specifications already described in section 3.3 for evaluation. A diode
array detector with an initial wavelength of 222 nm was used as the detection
method. CBD and THC, whose areas obtained and integrated by the software used.
The identification and corresponding quantification of the metabolites CBD and
THC were carried out, whose areas were obtained and integrated by the software
used.
Results and Discussion
1. Wavelength of equipment lamp (λ)
The
following wavelengths chosen were: 200 nm, 210 nm, 215 nm and finally, 222 nm. We studied their influence on the peak areas given in Figure1,
and record the retention times (see Figure
2).
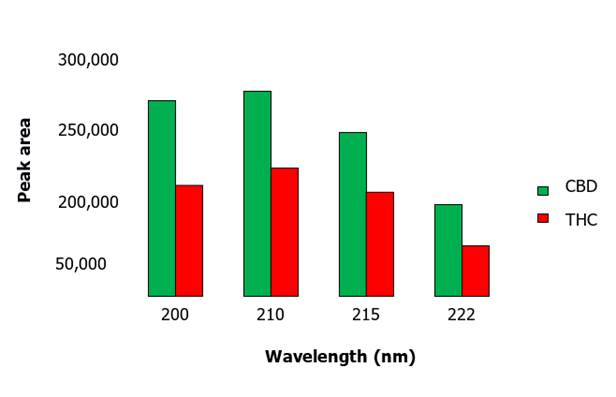
Figure
1. Peak area as a function of wavelength for CBD and THC. The highest absorbance of the peak areas of both Cannabidiol and
Tetrahydrocannabinol is observed at a
wavelength of 210 nm.
The areas quantified by the
detector lamp indicate that the
wavelength of highest absorption for the cannabinoids used in this work was 210 nm; the peak area starts to decline both above and below that wavelength.
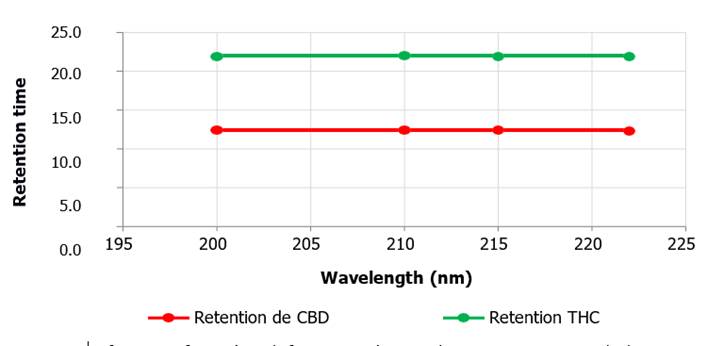
Figure 2. Retention
time as a function of wavelength for CBD and THC. The retention times with the
variation of the wavelength of the equipment
(P>0.05), this phenomenon is observed for both CBD and THC.
2. Operation temperature
The
following temperatures in degrees Celsius were considered: 51 ºC, 53ºC proposed by (Deidda et al., 2019), 54
ºC, 58 ºC and 60 ºC. All injections were performed
at a flow rate of 1 mL/min of the mobile phase with a pH of 3.45; the wavelength used was 210 nm.
The observed
peak areas corresponding to CBD were quite constant with values around 200,000 for the chosen temperature variations (Figure 3). Regarding
the THC metabolite, peak areas were between
120,000 and 128,000
under the same conditions. The retention times of both metabolites
decreased with increasing temperature (Figure 4).
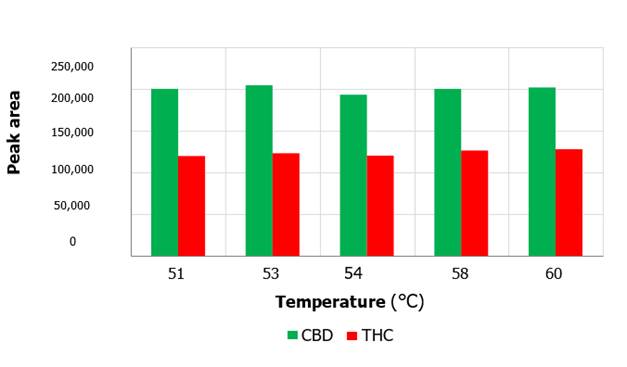
Figure 3. Peak area as a function of temperature variation
for CBD and THC metabolites (P>0.05).
The
longest retention time recorded
corresponded to THC with a time of approximately 24.5 minutes at 51 ºC and 15.8 minutes for a temperature of
60 ºC. Likewise, the longest retention time recorded
for CBD was 13.2 minutes at an injection temperature equal to 51 ºC and about 9.2 minutes at 60 ºC.
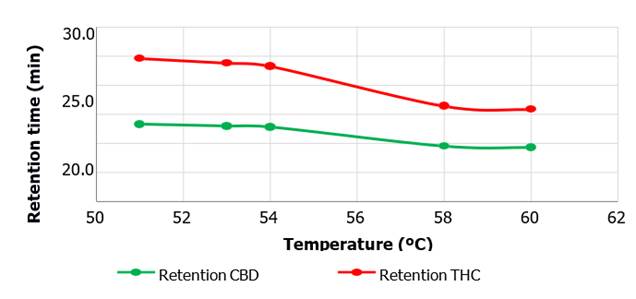
Figure 4. Retention time as a
function of temperature variation for CBD and THC metabolites. This graph shows the influence of temperature on
the retention times of the CBD and
THC metabolites. As the temperature increases, the retention time for both metabolites decrease.
3. Sample pH
For the pH evaluation, other chromatographic variables
such as temperature (about 53 ºC), elution flow and wavelength of 210 nm
were kept constant. All injections were performed with the same concentration of CBD and THC, as used in the previous
experiments. For CBD the peak areas were maintained at a value of approximately 260,000 within the pH range
3.15-3.60 arbitrarily chosen (Figure 5). The
shortest retention time for CBD was achieved at pH 3.45 which was about
12.3 minutes approximately (Figure
6). Proceeding in the same way, for THC the shortest retention time was obtained at pH 3.45, and the areas were
around 163,000 within the employed
pH range.
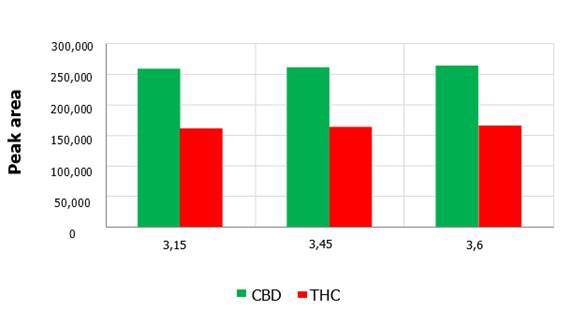
Figure.
5. Peak area as a function of mobile phase pH for
CBD and THC metabolites. The influence
of the pH on the peak area recorded for the CBD and THC metabolites is negligible.
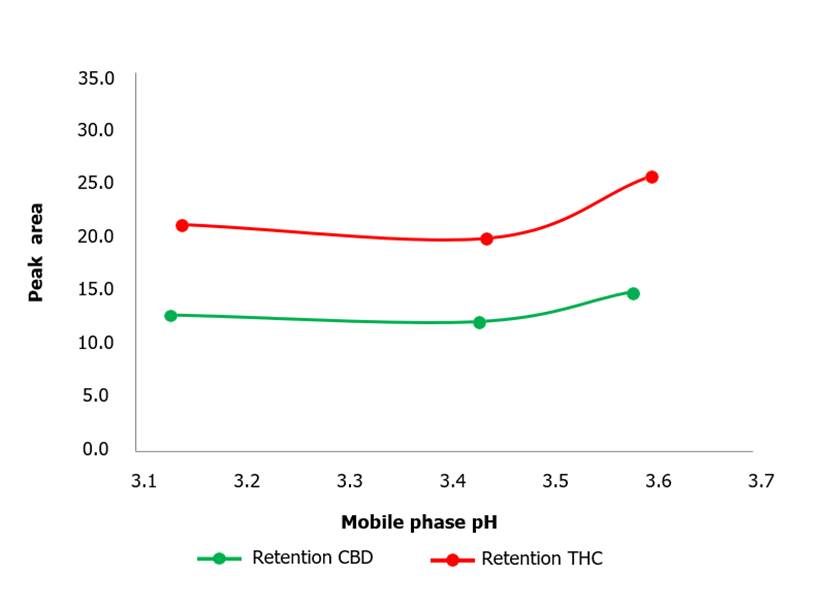
Figure 6. Retention time as a function of mobile phase pH for CBD and THC metabolites. The graph shows how retention
times are affected by the variation of ambient pH. As
the pH increases, the retention time increases.
Flow rate
To analyze the impact of the flow on the outcome, a constant temperature of 60 ºC, a wavelength of 210 nm and a pH of 3.45 were used. For each of the chromatographic runs, constant
concentrations of CBD and THC standards were
used. The standards were injected considering a range of mobile phase
flow rates, from 0.4 mL/min to 1.3 mL/min. The largest
areas recorded by the detector
were at a flow rate of 0.4 mL/min giving areas of 501,854 and 299,083
for the CBD and THC compounds respectively (Figure 7). On the other hand, the smallest areas were obtained for both metabolites at a flow
rate of 1.3 mL/min. Retention times were also
visibly affected by the elution
flow rate, giving in both cases the longest retention time at a flow rate of 0.4 mL/min, of approximately about 23.0 min for CBD and about 39.2 min for THC. The shortest retention time was achieved at a flow rate of
1.3 mL/min, reaching about 7.8 minutes for CBD and 13.9
minutes for THC (Figure 8).
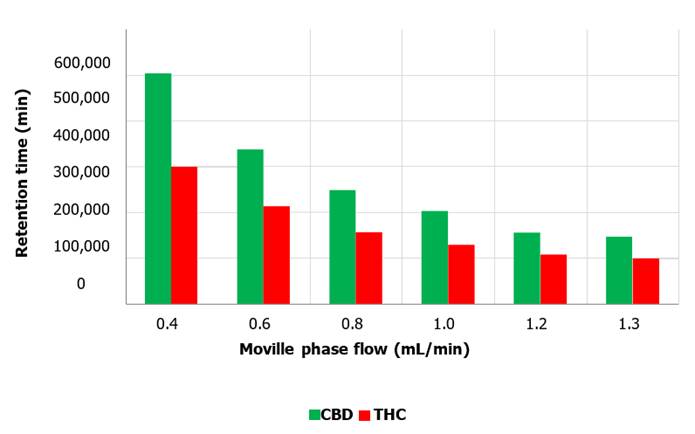
Figure 7. Peak
area as a function of mobile phase flow for CBD and THC metabolites. The graph exposes the influence of mobile
phase flow variation on the peak area of CBD
and THC cannabinoids, the largest areas were recorded at a flow rate of 0.4 mL/min for both metabolites.
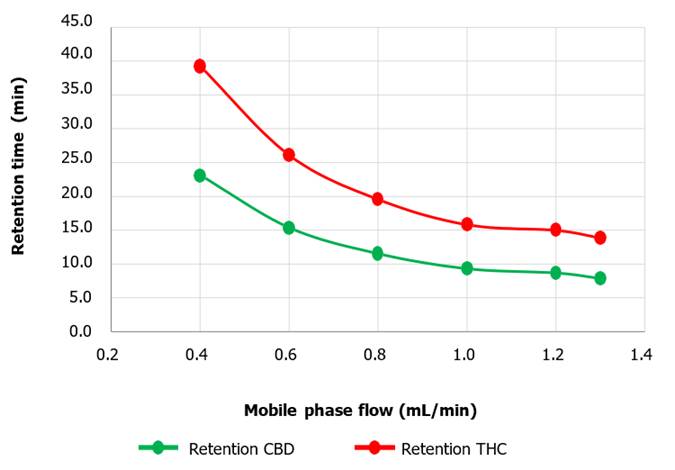
Figure 8. Peak area
as a function of mobile phase flow for CBD and THC metabolites. Influence of flow variation on the
retention times of CBD and THC metabolites. The lowest retention
fluxes were observed at 0.4 mL/min.
Calibration curves
After
analysis of the different variables, the following chromatographic conditions were chosen:
Temperature: 53 ºC, A working flux rate: 0,8 mL/min (of mobile phase), Wavelength: 210 n, pH of the medium:
3,45. Once the described run conditions were
programmed, the CBD and THC standards were diluted for
the construction of the calibration curve.
a.
CBD curve
 The graph of CBD area
obtained as a function of concentration (Figure 9) showed a linear correlation with an R² equal to
0.999 and an equation of the straight line equal to 𝑦 = 82273𝑥 + 21167.
The graph of CBD area
obtained as a function of concentration (Figure 9) showed a linear correlation with an R² equal to
0.999 and an equation of the straight line equal to 𝑦 = 82273𝑥 + 21167.
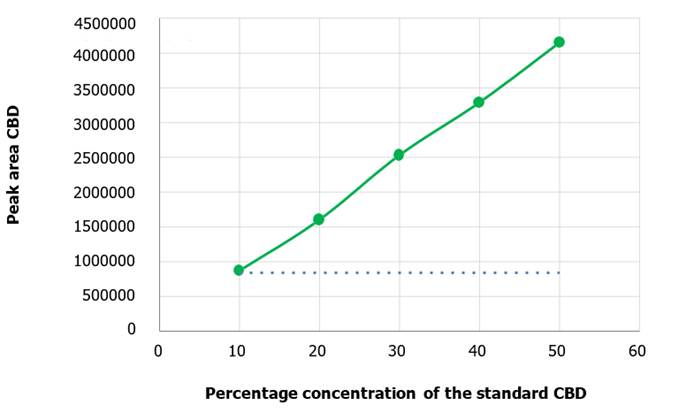
Figure 9.
Calibration curve for CBD. CBD concentration is the independent variable
and peak areas the dependent variable, presenting a positive slope.
b.
THC curve
As
with the CBD metabolite, the area of THC obtained was plotted as a function of concentration (Figure 10) and a linear
correlation was obtained with an R² equal to
0.999 and an equation
of the straight line equal to 𝑦 = 70985 𝑥 – 39092.
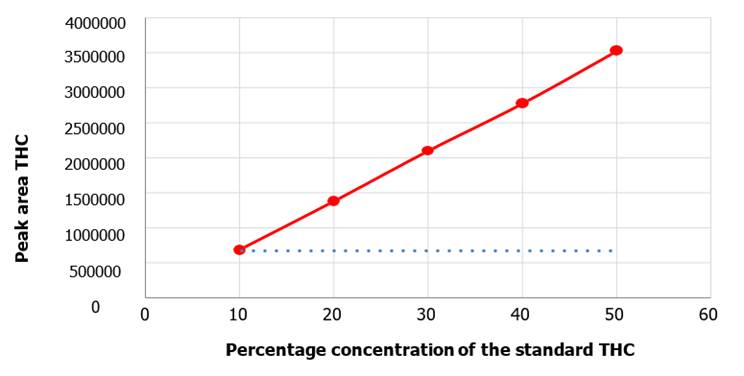
Figure 10. Calibration curve for
THC. THC concentration is the independent variable and the peak areas
the dependent variable, presenting a positive slope.
Elution
flow
The
influence of elution flow on the chromatographic run is clearly visible from
Figure 7. This effect is detected for both metabolites equally; with increasing
flow rate of the mobile phase, the recorded peak area decreases. Regarding CBD
and THC compounds, the area is inversely proportional to the elution flow rate.
The flow rate at which the standard is injected affects the speed at which the
analyte elutes and this has a direct impact on the recorded area, because the
higher the flow rate in which the metabolite is immersed, the less time the
detector will have to perform a purified quantification of the area. On the
other hand, the flux not only affects the magnitude of the area, but also the
retention time. As can be seen in Figure 8, the retention time for the study
compounds decreases with increasing flow rate, so behave the area values. The
retention time also correlates inversely with the flow velocity, since
increasing the velocity of the mobile phase increases the rate of carryover of
CBD and THC in the column. This results in a shorter time required for their
passage through the column.
Operation
temperature
Analyzing
Figure 3, it can be seen in detail that particularly for the studied
metabolites, there are only slight changes in the quantification of the
metabolite areas. All temperature variations were performed at the same elution
flow rate. This confirms that no major changes in the peak areas should be
observed for CBC and THC. However, observing Figure 4 elucidates the influence
of temperature on the retention times of both compounds. Increasing the
temperature slightly decreases the retention times of both CBD and THC. This
phenomenon could be explained by the fact that a higher temperature accelerates
the overall kinetics of all the eluting molecules, which would result in a
contribution, albeit small, to a higher net elution rate. Therefore, slight
variations in the retention times of the CBD and THC compounds with respect to
experiments at different temperatures but maintaining constant flow conditions,
pH and wavelength. Thus, it could be said that the influence of temperature
would be negligible for the quantification of the peak areas, but not so with
the retention times in which perceptible variations are observed, although the
latter are small (Yang 2008; Corradini et al., 2011).
Wavelength
The
wavelength proposed by relevant references is about 222 nm (Deidda et al.,
2019). Different wavelength modifications were carried out keeping the other
chromatographic variables constant. As can be seen in Figure 1, the wavelength
with the highest absorbance for the working species was 210 nm, obtaining areas
with values more than twice as high as for the wavelength of 222 nm, suggested
by the literature. As always, the result of such a measurement is a result of
all parameters. In this study the working conditions were different from those
of Deidda et al. (2019) , who used a 150 mm column while in the present work a
250 mm column was employed. Also, Deidda et al. (2019), worked with elution
flows different from those suggested by the previous bibliography, so such
changes would be expected when not working under the same conditions,
regardless of the fact that the same compounds were studied. It should be noted
that the absorbance of the species is not only closely related to the employed
wavelength but also to the already elapsed lifetime of the chromatograph lamp.
Influence
of pH
According
to Figure 5, the peak areas for CBD and THC remained relatively constant, only
subtle changes in magnitude were observed due to pH variations of the mobile
phase. The injections were performed at the same temperature and flow rate, and
the wavelength was also kept constant throughout the process for the study of
this variable. Following the same logic discussed above for the analysis of the
elution flow and temperature, by keeping these variables constant, no major
differences should be observed in the quantification of the areas by the detector.
What can be seen in Figure 6 is the influence of the pH on the retention time
for CBD and THC. It can be observed that the ideal pH for this methodology was
3.45. Values below or above this pH result in an increase in the retention
times for both metabolites. This can be explained by the fact that varying the
pH directly affects the degree of ionization of susceptible species in the
mobile phase, which in turn directly affects the affinity of CBD and THC
metabolites to the mobile and stationary phases. The affinity of these species
to the stationary phase for pH values different from 3.45 is increased,
consequently the elution speed is lower and the retention times increase (Yang,
2008; Ahuja y Dong 2005).
Calibration
curve
Extremely
high correlation coefficients were obtained in both calibration curves,
indicating a very close relationship between the dependent and independent
variables (area and concentration, respectively). Furthermore, a positive slope
was observed for both, the curves elaborated for CBD and THC (Figure 9 and Figure
10). This consistently denotes that an increase in their concentration in the
analyte it is accompanied by an increase in the peak area, which is
intrinsically related to the concentration in the analyte in a directly
proportional manner. (Figure 11, Figure 12).
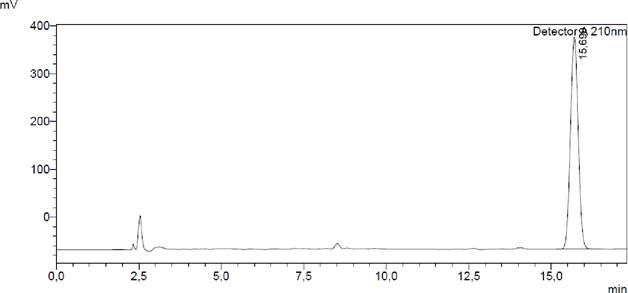
Chromatograms
Figure 11. Chromatogram of the CBD standard. The peak of Cannabidiol is recorded at approximately 15 minutes for the previously given conditions.
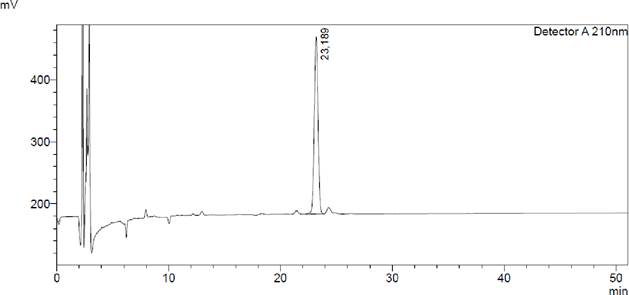
Figure
12. Chromatogram
of the THC standard. The peak of Tetrahydrocannabinol is recorded approximately 23 minutes under the condition
applied.
Conclusions
The chromatographic
conditions for the standardization of a methodology for the quantification of
cannabinoids CBD and THC were obtained, and the calibration curves for both
analytes were successfully constructed. This work could be a starting point for
the study of other cannabinoids and could serve as reference for their
quantification, when making the proper adjustments according to the characteristics
of the equipment to be used.
Authors' contributions: Conceptualization: J. F. A.,
A. R. Data Curation : J. F. A. Formal Analysis : J. F. A., E. F. B.
Funding Acquisition : J. F. A., H. D. N., A.S.O. Investigation :
J. F. A., H. D. N., A.S.O., E.F.B. .; Methodology : J. F. A., H. D. N.,
A.S.O. Project Administration : H. D. N., A.S.O. ;Resources : H.
D. N., A.S.O. Software : A. R. ; Supervision : H. D. N.,
A.S.O. Validation : J. F. A., E.F.B..; Visualization : E. F. B.,
A. R. ; Writing – Original Draft : J. F. A., H. D. N., A. S. O., E. F. B.
, A. R. ; Writing – Review & Editing : J. F. A., H. D. N., A. S. O.
Financing: No external financing
Disponibilidad de datos: Los datos utilizados en esta
investigación podrán ser solicitados al autor de correspondencia según
pertinencia.
References
Ahuja,
S. & Dong, M., editors. (2005). Handbook of Pharmaceutical Analysis by
HPLC. Inglaterra:
Elsevier.
Aizpurua-Olaizola, O., Omar, J., Navarro, P., Olivares,
M., Etxebarria, N. & Usobiaga A. (2014). Identification
and quantification of cannabinoids in Cannabis sativa L. plants by high
performance liquid chromatography-mass spectrometry. Anal Bioanal Chem. 406
(29) p. 7549–7560. doi: 10.1007/s00216-014-8177-x
SHIMADZU
Corporation. (2021) Software Download SHIMADZU. https://www.shimadzu.com/an/products/gas-chromatography/gc-accessories-components/advanced-flow-technology-series/aft-dl/index.html
Corradini,
D., Phillips, T., Cazes, J., editors. (2011). Handbook of HPLC. 2a Ed.. Vol.
101, Chomatographic Science Series. Boca Raton, Florida. Taylor & Francis
Group. 713 p.
De
Backer, B., Debrus, B., Lebrun, P., Theunis, L., Dubois, N. & Decock, L.
(2009) Innovative development and validation of an HPLC/DAD method for the
qualitative and quantitative determination of major cannabinoids in cannabis
plant material. Journal of Chromatography B Analytical Technologies Biomedical
and Life Sciences, 877 (32) p. 4115–4124. doi:
10.1016/j.jchromb.2009.11.004
Decreto
2725/19 (2020). https://baselegal.com.py/docs/aeeb9ada-33e4-11eb-a564-525400c761ca/text
Deidda,
R., Avohou, H. T., Baronti, R., Davolio, P. L., Pasquini, B. & Del Bubba,
M. (2019). Analytical quality by design: Development and
control strategy for a LC method to evaluate the cannabinoids content in
cannabis olive oil extracts. Journal of pharmaceutical and biomedical
analysis, 166, 3 p. 26–35. doi: 10.1016/j.jpba.2019.01.032
El Sohly,
M. A., Radwan, M. M., Gul, W., Chandra, S. & Gala, l. A. (2017).
Phytochemistry of Cannabis sativa L. In: Progress in the chemistry of
organic natural products. p. 1–36. doi: 10.1007/978-3-319-45541-9_1
Ferrere
Servicios Legales. (2021). Paraguay se convierte en líder mundial en la
industria del cáñamo industrial. Novedades.
https://www.ferrere.com/es/novedades/paraguay-se-convierte-en-lider-mundial-en-la-industria-del-canamo-industrial/
Glivar, T., Eržen, J., Kreft, S.,
Zagožen, M., Čerenak, A., Čeh, B., Tavčar Benković, E. (2020) Cannabinoid
content in industrial hemp (Cannabis sativa L.) varieties grown in
Slovenia. Industrial Crops and Products, 145. doi:
10.1016/j.indcrop.2019.112082
Hillig,
K. W. & Mahlberg, P. G. (2004). A Chemotaxanomic Analysis of Cannabinoid
Variation in Cannabis (Cannabaceae) American Journal of Botany, 91(6) p.
966–975. doi: 10.3732/ajb.91.6.966.
Kanabus, J., Bryła, M., Roszko, M.,
Modrzewska, M. & Pierzgalski, A. (2021). Cannabinoids—Characteristics and
Potential for Use in Food Production. Molecules, 26 (21),
6723. p. 1-36. doi: 10.3390/molecules26216723
Knight,
G., Hansen, S., Connor, M., Poulsen, H., McGovern, C., Stacey, J. (2010). The
results of an experimental indoor hydroponic Cannabis growing study, using the
'Screen of Green' (ScrOG) method-yield, tetrahydrocannabinol (THC) and DNA
analysis. Forensic Science International, 202 (1–3) p. 36–44. doi:
10.1016/j.forsciint.2010.04.022.
La
Nación. (2021). Cámara de Cáñamo en Paraguay definió como exitoso su primer año
de zafra e industrialización de productos. La Nación.
https://www.lanacion.com.py/negocios/2021/12/20/camara-de-canamo-en-paraguay-definio-como-exitoso-su-primer-ano-de-zafra-e-industrializacion-de-productos/
McRae,
G. & Melanson, J. E. (2020). Quantitative determination and validation of
17 cannabinoids in cannabis and hemp using liquid chromatography-tandem mass
spectrometry. Analytical and Bioanalytical Chemistry, 412 (27) p.
7381-7393. doi: 10.1007/s00216-020-02862-8.
Microsoft
Office 365. (2021). https://www.microsoft.com/es-ww/microsoft-365/get-office-and-microsoft-365-oem-
download-pag
Persia,
D., Mangiavacchi, F., Marcotullio, M. C., Rosati, O. (2023) Cannabinoids as
multifaceted compounds. Phytochemistry, 212. p. 1-20. doi:
10.1016/j.phytochem.2023.113718.
Pinto K. & Requicha J. F. (2024). Cannabis
sativa in veterinary medicine: Foundations and therapeutic
applications. The Canadian
Veterinary Journal, 65(9),
948-958. PMID: 39219599; PMCID: PMC11339888.
Radwan, M. M., Chandra, S., Gul, S.,
ElSohly, M. A. (2021). Cannabinoids, Phenolics, Terpenes and Alkaloids of Cannabis.
Molecules, 26(9) 2774. p. 1-29. doi: 10.3390/molecules26092774. PMID:
34066753; PMCID: PMC8125862.
Wakshlag,
J. J., Cital, S., Eaton, S. J., Prussin, R. & Hudalla, C. (2020).
Cannabinoid, Terpene, and Heavy Metal Analysis of 29 Over-the-Counter
Commercial Veterinary Hemp Supplements. Veterinary medicine (Auckland,
N.Z.), 11, p. 45–55. doi: 10.2147/VMRR.S248712
Vasantha
Rupasinghe, H. P., Davis, A., Kumar, S. K., Murray, B., Zheljazkov, V. D.
(2020). Industrial Hemp (Cannabis sativa subsp. sativa) as an Emerging
Source for Value- Added Functional Food Ingredients and Nutraceuticals. Molecules.
MDPI., 25 (18),. 1–24. doi: 10.3390/molecules25184078
Yang,
Y. (2008). High-Temperature Liquid Chromatography. Lc North America, 26, 2–8.