Introduction
Increasing the efficiency of beef cattle
production systems appears to be a critical aspect of addressing global food
security, at least in the short term. In tropical and subtropical areas, beef
cattle are mainly influenced by Bos indicus, although management
practices are often based on techniques formulated for Bos taurus
breeds, which are usually reared in temperate environments. It is important to
recognize that B. taurus and B. indicus are separate subspecies
that have developed distinct biological functions as a result of selective
pressures arising from complex evolutionary and domestication processes (Cooke et
al., 2020; Maciel et al., 2019).
The adaptation of zebu cattle to these
environments significantly improves their efficiency in coping with challenges
related to heat, humidity, nutrition, and disease. In high temperature
environments, this genetic group exhibits a more efficient balance between heat
generation and heat dissipation compared to taurine breeds (Utsunomiya et al.,
2019). However, their potential for meat production remains limited (Scheffler,
2022). In contrast, European breeds have a high capacity for meat production,
but are unable to fully exploit their genetic capabilities in tropical
environments. Given the limitations of both zebu and European breeds, the most
promising strategy for improving meat production in these regions is to use
cattle with optimal genetic traits obtained through crossbreeding (Rubio Lozano
et al., 2021). This methodology produces several advantageous results,
especially in commercial cattle production, such as the integration of two or
more favorable traits (complementarity) of the progenitor lines in the
commercial offspring.
The importance of crossbreeding lies in the
widely recognized phenomenon of hybrid vigor, or heterosis. This term refers to
the variation in phenotype observed between the average of crossbred
individuals and that of their purebred parents. Increased heterosis is observed
when the parents are less genetically related. Consequently, the first cross
(F1) exhibits maximum heterozygosity, resulting in the highest level of hybrid
vigor (Bunning et al., 2019). The main objective is to produce more efficient
animals by combining the exceptional adaptability of zebu cattle with the productive
capacity of taurine breeds, thus improving beef quality (Fernandes Júnior et
al., 2022).
Crossbreeding plays an important role in beef
production systems in tropical climates to improve growth, meat quality and
adaptability. However, recent decades have seen remarkable advances in
genotyping technologies, which have a wide range of applications, including
their valuable use in animal research (Kockum et al., 2023). Advances in this
field have been critical to the establishment and application of genomic
selection in animal production. This approach involves the use of genomic data
from individuals to estimate their genetic value, enabling informed decisions
on selection and crossing strategies (Eiríksson et al., 2022; Strandén et al.,
2019). In addition, these advances help address potential pedigree errors and
allow accurate prediction of the true breed composition of animals (Dodds et
al., 2014; Munoz et al., 2014).
Advances in genotyping have revolutionized
genetic research. Early methods relied on inferring genotypes from phenotypes,
progressing to tissue typing for transplant compatibility. The introduction of
RFLP-based genotyping in the 1970s was transformative, and PCR further
revolutionized the field in 1985. Microarray technology increased the
resolution of genotyping, allowing the simultaneous assessment of many genetic
variants. Genomic studies reached a new high watermark with the advent of whole
genome sequencing in 2014. Access to genotyping has been democratized in recent
years with the development of high-throughput and cost-effective
next-generation sequencing (Kockum et al., 2023).
Genomic selection (GS) is a state-of-the-art
breeding method that uses genetic markers distributed throughout the genome to
predict the genetic merit of candidates for selection based on specific
quantitative traits. The concept introduced by Meuwissen et al. (2001), is
characterized as a specialized form of marker-assisted breeding (MAB), where
each quantitative trait locus (QTL) is tested for linkage disequilibrium (LD)
with at least one genetic marker. This allows efficient selection of the
desired traits. The feasibility of this strategy has been greatly enhanced by
the large number of single nucleotide polymorphisms (SNP) identified by genome
sequencing and the emergence of innovative methods that can competently
genotype a large number of SNP (Goddard y Hayes, 2007). These molecular markers
provide a dense map of genetic variation in the genome, allowing more accurate
estimation of the genetic potential of parental lines and more accurate
prediction of progeny performance by selecting individuals carrying favorable
alleles. GS offers numerous benefits, including minimizing the need for
extensive field evaluations and accelerating the transfer of genetic advances
through shorter generation intervals and reduced costs. It also streamlines the
breeding cycle by facilitating the rapid identification of superior genotypes.
A phenotyped and genotyped training population (TP) is used to project genomic estimated
breeding values (GEBVs) for specific animals under GS. By eliminating the
laborious process of additional phenotyping, a breeding population (BP) can be
formed from the selected individuals and propagated through multiple
generations (Sinha et al., 2023). This method has fundamentally changed the
conduct of breeding programs, allowing more accurate and efficient selection
for favorable traits by using genomic data to estimate breeding values (Budhlakoti
et al., 2022).
However, its implementation has been mainly in
"simple" scenarios such as dairy cattle, where a single breed is used
worldwide. Many other situations require evaluation across breeds or in
crossbred populations. However, prediction accuracy has not been consistently
high. Several factors contribute to this: First, the genotype-environment
interaction (GEI) can vary due to different environments as well as
non-additive effects (Sinha et al., 2023). Second, even in the absence of a
significant GEI, differences in allele frequencies can lead to large
differences in the variance explained by each locus between breeds. Therefore,
further evaluation of the importance of each factor is required.
Adoption of GS in beef cattle has been slow. The potential
benefits for improving genetic progress are substantial, especially considering
the critical importance of traits that are difficult and costly to measure
routinely, but have a significant impact on profitability. Despite this
potential, the precision of reported genetic breeding values for these traits
in cattle remains limited, typically falling within a range of low to moderate
levels (Esrafili Taze Kand Mohammaddiyeh et al., 2023). Hayes et al. (2013)
acknowledge this circumstance in two ways: First, the reference populations
established for beef cattle tend to be smaller than those for dairy cattle,
resulting in a lack of bulls with extensive accurate progeny testing in the
beef industry. Second, in contrast to the dominance of a few breeds in dairy
cattle populations worldwide, the beef cattle landscape includes a variety of
significant breeds, including two distinct subspecies (B. taurus and B.
indicus).
Given the complex nature of breeding initiatives in tropical and
subtropical climates and the variety of breeds involved, our research aims to
address the obstacles associated with implementing GS in beef cattle. The
primary goal of this research is to assess the efficacy of various
crossbreeding methodologies and SNP selection approaches in enhancing the
precision of genomic predictions. By analyzing distinct SNP selection criteria,
including those that consider allele frequency variations among breeds, we
endeavor to augment the accuracy of GS within crossbred populations. This
inquiry aspires to contribute to the progression of beef cattle breeding
programs, especially in areas where crossbred animals are commonly utilized.
Through the optimization of genomic prediction frameworks, we can substantially
enhance the selection of superior livestock, thereby promoting the
sustainability and profitability of beef production systems in tropical and
subtropical environments.
Materials and methods
Genotype data
High-density
genotyping data (∼777K SNP marker variants)
were obtained from the WIDDE public database (http://widde.toulouse.inra.fr).
After applying a quality filter, the genotyping density ranged from 708,206 and
541,246 genetic markers for the eight included (details provided in Table 1).
Genotypes from Angus (N=42), Brangus (N=12), Brahman (N=46), Hereford (N=35),
Nelore (N=31), Red Angus (N=10), Senepol (N=12), and Santa Gertrudis (N=32)
were downloaded, as these breeds are the most commonly used in intensive
production systems in subtropical climate. It is noteworthy that Angus (ANG),
Hereford (HFD), and Red Angus (RGU) breeds belong to the Bos taurus
subspecies, while Brahman (BRM) and Nelore (NEL) breeds represent the Bos
indicus subspecies. The hybrid or crossbred breeds used in this study were
Brangus (BRG), Senepol (SEN) and, Santa Gertrudis (SGT) breeds. Only autosomal
SNP with a maximum missing rate of 25% and a minimum allele frequency of 1%
were retained. Individuals with more than 5% missing genotypes were also
excluded. Missing SNP were imputed using BEAGLE 4.1 (Browning & Browning,
2016). Principal component analysis (PCA) was performed to cluster individuals
and remove outliers (Figure 1). Eight outliers from the Hereford samples were
excluded during this process for an initial analysis. Subsequently, samples
from Brahman and Nelore breeds were clustered into a single generic population
of the Indicus subspecies (IND), as were animals from the Red and Standard
Angus breeds (ANG). This was done to obtain a “retained” population that
combines the two main subspecies, taking into account the homogeneity of the
samples within each group. Similarly, samples from Brangus and Senepol were
grouped under the abbreviation BSP. Plink v1.9 software (Purcell et al., 2007) was
utilized to calculate allele frequencies for each population and genetic
differentiation indices (Fst) between them. Following SNP and sample filtering,
721,136 SNP from 212 samples were used for an initial analysis, and 659,644 SNP
from 129 samples were used for the “retained” population (Table 1).
Table
1. Summary
of samples analyzed. The “retained” population, composed of the Angus and Red
Angus (ANG) breeds and the Brahman and Nelore (IND) breeds, is indicated in
italics.
Tabla 1. Resumen de muestras analizadas.
La población “retenida” está compuesta por las razas Angus y Red Angus (ANG) y
las razas Brahman y Nelore (IND), en cursiva.
|
Breed
|
Code
|
No. of
samples
|
New Code
|
No. of
samples after
SNP
quality control
|
No. of
markers
before/after
quality filtering
|
|
Angus
|
ANG
|
42
|
ANG
|
52
|
732,993
/ 618,367
|
|
Red
Angus
|
RGU
|
10
|
732,993
/ 574,342
|
|
Brangus
|
BRG
|
12
|
BSP
|
24
|
732,993
/ 670,560
|
|
Senepol
|
SEN
|
12
|
732,993
/ 626,727
|
|
Hereford
|
HFD
|
35
|
HFD
|
27
|
732,993
/ 644,421
|
|
Brahman
|
BRM
|
46
|
IND
|
77
|
732,993
/ 657,641
|
|
Nelore
|
NEL
|
31
|
732,993
/ 541,246
|
|
Santa
Gertrudis
|
SGT
|
32
|
SGT
|
32
|
732,993
/ 708,206
|
Genetic architectures
In temperate climates, cattle breeding is mainly aimed at
growth rate (O’Neill et al., 2010) and meat quality (Schutt et al., 2009). In tropical
climates, parasite and heat resistance are also relevant, as these are the main
constraints on animal performance. To represent these related traits, we aimed
to simulate body weight gain, shear force (meat quality), and general heat and
parasite tolerance. To generate “realistic” genetic architectures, we
downloaded QTL regions for each of these three sets of phenotypes from the QTL
database Supplementary Table 1 (Hu et al., 2022; Ramírez Ayala, 2024).
We selected SNP within these QTL regions from the HD bovine array as putative
causal SNP for each of the phenotypes. Causal SNP were selected from those with
the 10% highest average Fst within regions smaller than 1MB around the QTL
positions. From all potential candidate markers, 200 SNP were selected as
causal for each phenotype.
Genetic effects
were generated from a gamma distribution Γ (shape = 0.2 and scale = 5) (Caballero et al., 2015),
multiplied by the sign of the difference between the mean of the allele
frequencies of the two purebred taurine breeds (ANG and HFD) and the allele
frequency of the zebu population (IND). In agreement with the literature (Boonkum
& Duangjinda, 2015; Elzo et al., 2012; Kim et al., 2003; Machado et al.,
2010), complete dominance was assumed for tolerance, and additivity in the two
remaining phenotypes. Heritability values (h2) were taken from the literature
(Alencar et al., 2005; Berry & Crowley, 2013; Burrow, 2001, 2012; Burrow et
al., 2001; Cucco et al., 2010; Henshall, 2004; Hewetson, 1972; Su et al., 2010;
Watterson, 1975), with shear force h2 = 0.3, growth h2 =
0.24, and tolerance h2 = 0.4.
Evaluated
crossing programs and genotyping strategies
We compared three of the most common crosses used in
tropical climates: F1, grading up and rotational crosses (Galukande et al.,
2013; Leroy et al., 2016). The terminal or F1 system involves crossing pure
zebu with taurine animals, maximizing individual heterosis in the cross and
combining the desirable effects of the two breeds for direct and maternal
genetic effects. The grading up system is a backcross that replaces an initial
F1 population by systematically crossing the female progeny with taurine bulls.
The objective is to replace animals with low productivity with individuals
showing better performance while maintaining resistant animals. The two-breed
rotational cross, also known as the “criss-cross” system, is a widely used and
straightforward approach to crossbreeding. In this system, two different breeds
are crossed, and the resulting female offspring are kept as replacements and
then crossed back to one of the original breeds. Subsequently, these female
offspring are bred with males from their sire's alternate breed. Implementing
this system requires at least two separate breeding pastures (if relying solely
on natural service), with each pasture dedicated to a specific breed of sire.
Additionally, cows need to be accurately identified based on the breed of their
sire. Over multiple generations, this system allows for the realization of
approximately 67% of the maximum possible heterosis. Another advantage is the
significant number of heifers available for replacement selection.
In each of the three schemes, 400 animals were simulated.
One generation was simulated for the terminal cross, while four generations
were simulated for the other two schemes, with each generation consisting of
100 progenies. Individual genotypes from the base population (ANG=52 and
IND=77) were downloaded and processed as described. We evaluated the
performance of genomic prediction (GP) by cross-validation using GBLUP
(VanRaden, 2008). In the F1 cross, phenotypes from 200 animals were removed,
and the correlation between predicted and actual phenotypes for each of the
traits was compared. We will refer to this correlation as “predictive ability”
(PA). In either the grading or rotational crosses, PA was calculated for
phenotypes from the last two generations (N=200). Three SNP chips were
compared:
1. Chip 1: 50 k SNP selected
at random, evenly distributed across the genome.
2. Chip 2: 50 k SNP randomly
selected from those with a maximum allele difference of 0.09 between Angus and
Indicus.
3. Chip 3: 50 k SNP randomly selected
from those with a maximum allele difference of 0.09 between Angus and Indicus
frequencies and a maximum allele frequency (MAF) of the Angus population of 0.2
< MAF < 0.8.
SNP were selected from those available on the HD chip.
The
SeqBreed tool (Pérez-Enciso et al., 2020) was used to implement the simulation
and GP described above. SeqBreed allows automatic implementation of standard
genomic selection procedures such as GBLUP.
Results
Principal Component Analysis
of Populations
The genetic
structure between and within breeds was assessed using PCA. We conducted two
analyses, first considering all breeds initially selected and then only the
"retained" populations. For all breeds analyzed (Figure 1.A), PC1
accounts for 29% of the total variation, separating the zebu population
(Brahman and Nelore) from the taurine breeds (Angus, Hereford and Red Angus).
We also observed that the hybrid breeds are closer to the taurine breeds than
to the Indicus breeds, likely due to their higher percentage of European
genetic background. Notably, the Angus (ANG) and Red Angus (RGU) breeds form a
single group, as do the Brahman (BRM) and Nelore (Nel) zebus. PC2, which
accounts for 5% of the total variation, separates the zebu and Hereford breeds
from the others. The second PCA, performed only on the "retained"
populations, shows a clear separation between the two subspecies, Bos taurus
and Bos indicus (Figure 1B).
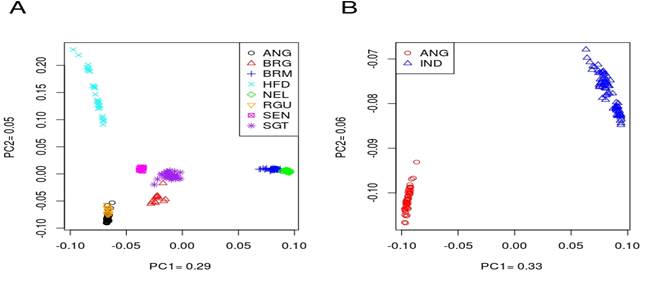
Figure 1. (A) Principal component
analysis using all samples. Individuals are grouped in to Bos taurus, Bos
indicus and Hybrid categories. Black: Angus, red: Brangus, blue: Brahman,
cyan: Hereford, green: Nelore, orange: Red Angus, magenta: Senepol, purple:
Santa Gertrudis; (B) Principal component analysis for “retained” population.
Red: Angus (Angus + Red Angus), blue: Indicus (Brahman + Nelore).
Figura 1. (A) Análisis de
componentes principales utilizando todas las muestras. Los individuos se
agrupan en Bos taurus, Bos indicus e híbrido. Negro: Angus, rojo:
Brangus, azul: Brahman, cian: Hereford, verde: Nelore, naranja: Red Angus,
magenta: Senepol, púrpura: Santa Gertrudis; (B) Análisis de componentes
principales
para la población “retenida”. Rojo: Angus (Angus + Red Angus), azul: Indicus
(Brahman + Nelore)
Predictive accuracy
Figure 2
illustrates the predictive ability (PA) across chips and breeding schemes for
each phenotype. Overall, Chip 1 (50k random SNP) and rotational crosses were
identified as the most effective strategies, although variations were observed between
traits. Notably, for tolerance, PA was significantly lower, and the differences
between genotyping or breeding strategies were less pronounced.
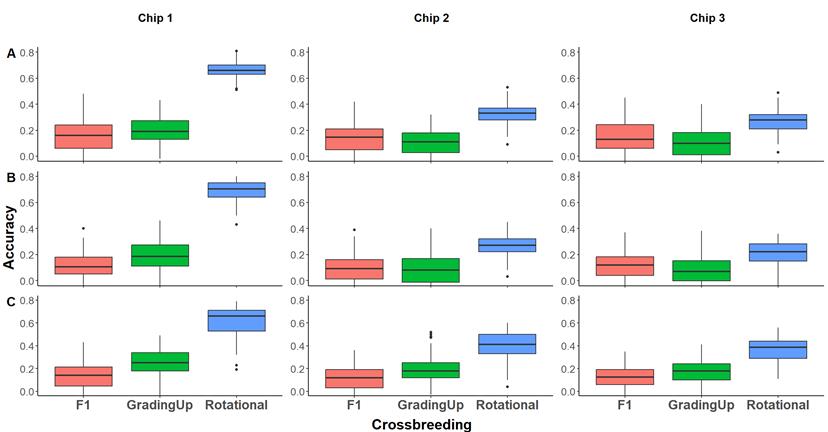
Figure
2.
Correlations according to the crossbreeding scheme. (A). Shear, (B). Weight,
(C). Tolerance vs. all chips. Red boxes indicate F1 or terminal crossing
scheme, green boxes indicate grading up and, blue boxes indicate rotational,
for all cases.
Figura 2. Correlaciones según el
esquema de cruzamiento. (A). Corte, (B). Peso, (C).
Tolerancia vs. todos los chips. Los recuadros rojos indican esquema de
cruzamiento F1 o terminal, los recuadros verdes indican clasificación
absorbente y los recuadros azules indican rotacional, para todos los casos.
The overall
effect of the chips on PA is illustrated in Figure 3. Chip 1 (50k random)
exhibited the highest PA (0.26), followed by Chip 2 (0.18) and Chip 3 (0.17).
The random selection of SNP is the most effective strategy while setting
restrictions on Fst or allele frequency does not significantly improve PA.
Regarding the breeding scheme, the advantage of the rotational cross is
prominently highlighted on average (Figure 4). The rotational scheme
demonstrated a higher correlation (0.38) compared to the other two schemes, F1
(0.12) and grading up (0.16).
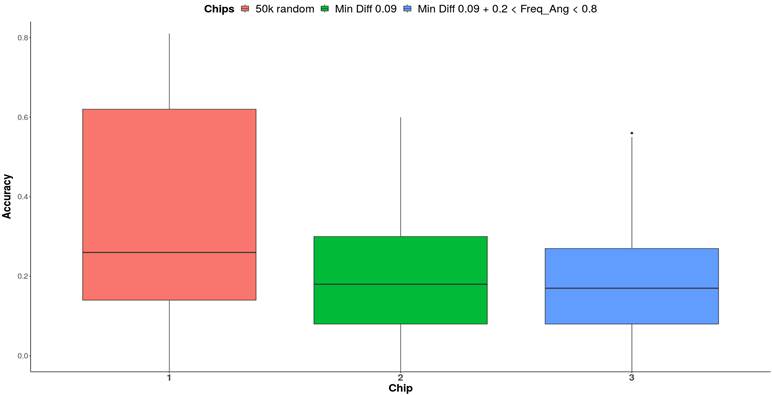
Figure
3. Global
effect of the chips on the phenotypes.
Figura 3. Efecto global de los chips
sobre los fenotipos.
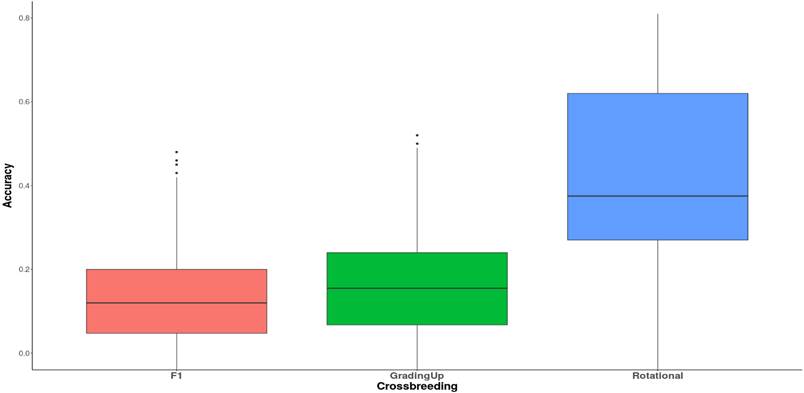
Figure
4. Global
effect of the crossing on the phenotypes.
Figure 4. Efecto global del cruce
sobre los fenotipos.
Discussion
The Principal Component Analysis (PCA) applied to genotype
data, comprising 721,136 SNP from 212 cattle across 8 breeds, reveals distinct
clustering based on their Indicus or Taurus lineages, as illustrated in Figure
1. Furthermore, within the "retained” population, which encompasses
659,644 SNP from 129 samples representing 4 breeds grouped by homogeneity in
the two subspecies (ANG and IND), similar separations are observed. These
observations align with documented cattle history (Bovine Hapmap Consortium,
2009; Kasarapu et al., 2017; Porto-Neto et al., 2014; Ward et al., 2022).
Random selection of markers, such as SNP, could
significantly enhance the accuracy of genomic prediction for economically
important traits in beef cattle production systems raised in tropical
ecosystems. Among the SNP selection criteria compared (see Materials and
Methods), Chip 1, corresponding to the random selection of SNP from a
high-density (700k) chip, emerged as the optimal choice for all proposed traits
(Figure 3). Pérez Enciso et al. (2017), who reported a modest advantage in
prediction accuracy between sequences and commercial or random SNP matrices
using GBLUP. Moreover, recent research by Rodriguez Neira et al. (2022),
employing another genomic prediction method (ssGBLUP), found compelling
evidence supporting the feasibility and cost-effectiveness of employing genomic
selection in beef cattle using custom panels with low SNP density. They noted
that this approach maintained the predictive accuracy of genomic information.
These results offer promising prospects for beef cattle breeding programs,
suggesting the potential development of in silico SNP marker panels for
GEBV prediction. By minimizing the number of SNP requiring imputation, this
approach may streamline the process. Additionally, the study implies that
stringent criteria for SNP selection in custom panels may not be necessary, as
long as the markers are adequately distributed across the genome and possess
high informative value.
Contrary to the benefits observed with random marker
selection, the strategy of selecting markers based on differences in allele
frequencies between breeds may not prove effective. Previous studies (Dadi et al.,
2012; Moghaddar et al., 2014), have highlighted that disparities in
allele frequencies among breeds can arise from various factors, including
recent genetic drift and ancient divergence among cattle breeds. These
differences can lead to the selection of markers that inadequately capture
relevant genetic variability within each breed. Moreover, incorporating data
from animals of different breeds may decrease the accuracy of genomic
estimations, as noted in the literature. This suggests that marker selection
solely based on allele frequency differences between breeds may not be optimal
and could, in fact, detrimentally impact the precision of genomic predictions.
Therefore, considering these factors and the potential for allele
frequency-based marker selection to yield unexpected outcomes, it is prudent
not to recommend this strategy, as it may lead to erroneous decisions in cattle
genetic improvement programs.
Crossbreeding
strategies such as either terminal or rotational crossing, synthetic breed
creation, or breed replacement are frequently advocated for enhancing farmers'
incomes by boosting livestock productivity. Rotational crossing involves the
utilization of crossbred dams mated alternately to different breeds, varying
the genetic composition of the dams from one generation to the next. While
similar to terminal crossing in requiring a steady supply of purebred genetic
material, rotational crossing requires it only on the male side, reducing costs
for the breeders, particularly in situations where semen or low-cost males are
readily available. Both terminal
and rotational crosses aim to optimize heterozygosity and the resulting
heterosis effect, although heterosis tends to be less under rotational crosses.
These strategies necessitate managing two or more parental lines, with a market
chain providing farmers with either purebred reproducers or semen (Leroy et
al., 2016). Upgrading, or top-crossing, involves using the same sire breed in
each generation to increase the proportion of a particular purebred within a
herd, commonly observed in taurine breeds. However, upgrading beyond 75%
temperate blood may pose challenges under severe climatic conditions or if
management practices do not keep pace with the genetic potential of the herd
(Rendel, 1974). Our findings suggest that the rotational scheme (Figure 4)
yields the highest overall accuracy compared to other crossing systems such as
F1 and grading up. Rotational crossbreeding has demonstrated substantial
enhancements in animal productivity. However, its maintenance requires
meticulous planning and record-keeping. Notably, in the initial generations of
crossbreeding, significant diversity in size, body condition, and other traits
may arise, contingent upon the breed used. The efficacy of this approach hinges
on selecting superior sires within purebreds, which, in turn, depends on the
cost and consistent supply of material with high genetic potential. Likewise,
purebreds rely on within-breed selection for genetic enhancement (Cv, 2015;
Galukande et al., 2013, Leroy et al., 2016).
Conclusion
Our
genomic selection (GS) simulations offer valuable insights into crossbreeding
schemes in tropical climates. Our findings underscore the effectiveness of
rotational crossing systems in achieving higher predictive accuracy,
highlighting the importance of genetic diversity for improving desired traits
in tropical cattle. Furthermore, our results advocate for the random selection
of SNP as a practical and effective approach in trait prediction. However, caution
is warranted regarding SNP selection based on allele frequency differences
between breeds, as our study suggests it may not yield significant benefits and
could even be detrimental. While our conclusions provide valuable guidance for
cattle breeding programs, it is important to acknowledge the limitations
inherent in sample sizes across breeds and the necessity for further research
to validate and refine these findings.
Acknowledgements:
MPE is
funded by MINECO grant AGL2016-78709-R and from the EU through the
BFU2016-77236-P (MINECO/AEI/FEDER, EU) and the “Centro de Excelencia Severo
Ochoa 2016-2019” award SEV-2015-0533. LCRA is funded by "Don Carlos
Antonio López" Graduate program (BECAL) from Paraguay.
Authors' contributions: L.C.R.A.,
and M.P.E. designed the study, analyzed the data, interpreted the results, and
wrote the manuscript. J.L.C., M.L.Z., E.R.G., and Y.R.C. edited and reviewed
the manuscript and approved the final version. Conceptualization:
L.C.R.A., M.P.E. Experiment desing: L.C.R.A., M.P.E. Experiment
execution: L.C.R.A., M.P.E. Experiment verification: L.C.R.A.,
M.P.E. Data analysis/interpretation: L.C.R.A., M.P.E. Statitical
analysis: L.C.R.A., M.P.E. Manuscript preparation: L.C.R.A.,
M.P.E. Manuscript editing and revision: L.C.R.A., J.L.C., L.M.Z., E.R.,
Y.R.-C., M.P.E. Approval of the final manuscript version:
L.C.R.A., J.L.C., L.M.Z., E.R., Y.R.-C., M.P.E.
Financing: No external financing.
Data availability: Data supporting the findings of this
study are available from the corresponding autor, upon reasonable request.
Referencias
Bibliográficas
Alencar,
M. M., Fraga, A. B., é da Silva, A. M. (2005). Adaptação de genótipos a
ambientes tropicais resistência à mosca-dos-chifres (Haematobia irritans,
linnaeus) e ao carrapato (Boophilus microplus, CANESTRINI) em diferentes
genótipos bovinos. Agrociencia, 9 (1-2), 579–585.
Berry,
D. P., & Crowley, J. J. (2013). Cell biology symposium: Genetics of feed
efficiency in dairy and beef cattle. Journal of Animal Science, 91(4),
1594–1613. https://doi.org/10.2527/jas.2012-5862
Boonkum,
W., & Duangjinda, M. (2015). Estimation of genetic parameters for heat
stress, including dominance gene effects, on milk yield in Thai Holstein dairy
cattle. Animal Science Journal, 86(3), 245–250.
https://doi.org/10.1111/asj.12276
Bovine
Hapmap Consortium. (2009). Genome-Wide Survey of SNP Variation Uncovers the
Genetic Structure of Cattle Breeds. Science, 324(5926), 528–532.
https://doi.org/10.1126/science.1167936
Browning,
B. L., & Browning, S. R. (2016). Genotype Imputation with Millions of
Reference Samples. American Journal of Human Genetics, 98(1),
116–126. https://doi.org/10.1016/j.ajhg.2015.11.020
Budhlakoti,
N., Kushwaha, A. K., Rai, A., Chaturvedi, K. K., Kumar, A., Pradhan, A. K.,
Kumar, U., Kumar, R. R., Juliana, P., Mishra, D. C., and Kumar, S. (2022).
Genomic Selection: A Tool for Accelerating the Efficiency of Molecular Breeding
for Development of Climate-Resilient Crops. Frontiers in Genetics, 13.
https://doi.org/10.3389/fgene.2022.832153
Bunning,
H., Wall, E., Chagunda, M. G. G., Banos, G., & Simm, G. (2019). Heterosis
in cattle crossbreeding schemes in tropical regions: meta-analysis of effects
of breed combination, trait type, and climate on level of heterosis. Journal
of Animal Science, 97(1), 29–34. https://doi.org/10.1093/jas/sky406
Burrow,
H. M. (2001). Variances and covariances between productive and adaptive traits
and temperament in a composite breed of tropical beef cattle. Livestock
Production Science, 70(3), 213–233.
https://doi.org/10.1016/S0301-6226(01)00178-6
Burrow,
H. M. (2012). Importance of adaptation and genotype × environment interactions
in tropical beef breeding systems. Animal, 6(5), 729–740.
https://doi.org/10.1017/S175173111200002X
Burrow,
H. M., Moore, S. S., Johnston, D. J., Barendse, W., & Bindon, B. M. (2001).
Quantitative and molecular genetic influences on properties of beef: A review. Australian
Journal of Experimental Agriculture, 41(7), 893–919.
https://doi.org/10.1071/EA00015
Caballero,
A., Tenesa, A., & Keightley, P. D. (2015). The Nature of Genetic Variation
for Complex Traits Revealed by GWAS and Regional Heritability Mapping Analyses.
Genetics, 201(4), 1601–1613.
https://doi.org/10.1534/genetics.115.177220
Cooke,
R. F., Daigle, C. L., Moriel, P., Smith, S. B., Tedeschi, L. O., &
Vendramini, J. M. B. (2020). Cattle adapted to tropical and subtropical
environments: social, nutritional, and carcass quality considerations. Journal
of Animal Science, 98(2). https://doi.org/10.1093/jas/skaa015
Cucco,
D., Ferraz, J., Eler, J., Balieiro, J., Mattos, E., & Varona, L. (2010).
Genetic parameters for postweaning traits in Braunvieh cattle. Genetics and
Molecular Research, 9(1), 545–553.
https://doi.org/10.4238/vol9-1gmr764
Cv,
S. (2015). Cross-breeding in Cattle for Milk Production: Achievements, Challenges
and Opportunities in India-A Review. Advances in Dairy Research, 4(3),
1–14. https://doi.org/10.4172/2329-888x.1000158
Dadi,
H., Kim, J. J., Yoon, D., & Kim, K. S. (2012). Evaluation of Single
Nucleotide Polymorphisms (SNPs) Genotyped by the Illumina Bovine SNP50K in
Cattle Focusing on Hanwoo Breed. Asian-Australasian Journal of Animal
Sciences, 25(1), 28–32. https://doi.org/10.5713/ajas.2011.11232
Dodds,
K. G., Auvray, B., Newman, S. A. N., & McEwan, J. C. (2014). Genomic breed
prediction in New Zealand sheep. BMC Genetics, 15, 92.
https://doi.org/10.1186/s12863-014-0092-9
Eiríksson,
J. H., Strandén, I., Su, G., Mäntysaari, E. A., & Christensen, O. F.
(2022). Local breed proportions and local breed heterozygosity in genomic
predictions for crossbred dairy cows. Journal of Dairy Science, 105(12),
9822–9836. https://doi.org/10.3168/jds.2022-22225
Elzo,
M. A., Johnson, D. D., Wasdin, J. G., & Driver, J. D. (2012). Carcass and
meat palatability breed differences and heterosis effects in an Angus-Brahman
multibreed population. Meat Science, 90(1), 87–92.
https://doi.org/10.1016/j.meatsci.2011.06.010
Esrafili
Taze Kand Mohammaddiyeh, M., Rafat, S. A., Shodja, J., Javanmard, A., &
Esfandyari, H. (2023). Selective genotyping to implement genomic selection in
beef cattle breeding. Frontiers in Genetics, 14, 1083106.
https://doi.org/10.3389/fgene.2023.1083106
Fernandes
Júnior, G. A., Peripolli, E., Schmidt, P. I., Campos, G. S., Mota, L. F. M.,
Mercadante, M. E. Z., Baldi, F., Carvalheiro, R., & de Albuquerque, L. G.
(2022). Current applications and perspectives of genomic selection in Bos
indicus (Nellore) cattle. Livestock Science, 263.
https://doi.org/10.1016/j.livsci.2022.105001
Galukande,
E., Mulindwa, H., Wurzinger, M., Roschinsky, R., Mwai, A. O., & Sölkner, J.
(2013). Cross-breeding cattle for milk production in the tropics: achievements,
challenges and opportunities. Animal Genetic Resources/Ressources Génétiques
Animales/Recursos Genéticos Animales, 52, 111–125. https://doi.org/10.1017/s2078633612000471
Goddard,
M. E. & Hayes, B. J. (2007). Genomic selection. Journal of Animal
Breeding and Genetics, 124(6), 323–330.
https://doi.org/10.1111/j.1439-0388.2007.00702.x
Hayes,
B. J., Lewin, H. A., & Goddard, M. E. (2013). The future of livestock
breeding: genomic selection for efficiency, reduced emissions intensity, and
adaptation. Trends in Genetics, 29(4), 206–214.
https://doi.org/10.1016/j.tig.2012.11.009
Henshall,
J. M. (2004). A genetic analysis of parasite resistance traits in a tropically
adapted line of Bos taurus. Australian Journal of Agricultural Research,
55(11), 1109–1116. https://doi.org/10.1071/AR03085
Hewetson,
R. W. (1972). The inheritance of resistance by cattle to cattle tick. Australian
Veterinary Journal, 48(5), 299–303.
https://doi.org/10.1111/j.1751-0813.1972.tb05161.x
Hu,
Z. L., Park, C. A., & Reecy, J. M. (2022). Bringing the Animal QTLdb and
CorrDB into the future: meeting new challenges and providing updated services. Nucleic
Acids Research, 50(D1), D956–D961.
https://doi.org/10.1093/nar/gkab1116
Kasarapu,
P., Porto-Neto, L. R., Fortes, M. R. S., Lehnert, S. A., Mudadu, M. A.,
Coutinho, L., Regitano, L., George, A., & Reverter, A. (2017). The Bos taurus–Bos
indicus balance in fertility and milk related genes. PLoS ONE, 12(8),
e0181930. https://doi.org/10.1371/journal.pone.0181930
Kim,
J.-J., Farnir, F., Savell, J., & Taylor, J. F. (2003). Detection of
quantitative trait loci for growth and beef carcass fatness traits in a cross
between Bos taurus (Angus) and Bos indicus (Brahman) cattle. Journal of
Animal Science, 81(8), 1933–1942.
https://doi.org/10.2527/2003.8181933x
Kockum,
I., Huang, J., & Stridh, P. (2023). Overview of Genotyping Technologies and
Methods. Current Protocols, 3(4), e727.
https://doi.org/10.1002/cpz1.727
Leroy,
G., Baumung, R., Boettcher, P., Scherf, B., & Hoffmann, I. (2016). Review:
Sustainability of crossbreeding in developing countries; definitely not like
crossing a meadow…. Animal: An International Journal of Animal Bioscience,
10(2), 262–273. https://doi.org/10.1017/S175173111500213X
Machado,
M. A., Azevedo, A. L., Teodoro, R. L., Pires, M. A., Peixoto, M. G., de
Freitas, C., Prata, M. C., Furlong, J., da Silva, M. V., Guimarães, S. E.,
Regitano, L. C., Coutinho, L. L., Gasparin, G., & Verneque, R. S. (2010).
Genome wide scan for quantitative trait loci affecting tick resistance in
cattle (Bos taurus × Bos indicus). BMC Genomics, 11, 280.
https://doi.org/10.1186/1471-2164-11-280
Maciel,
I. C. F., Barbosa, F. A., Tomich, T. R., Ribeiro, L., Alvarenga, R. C., Lopes,
L. S., Malacco, V. M. R., Rowntree, J. E., Thompson, L. R., & Lana, Â. M.
Q. (2019). Could the breed composition improve performance and change the
enteric methane emissions from beef cattle in a tropical intensive production
system? PLoS ONE, 14(7), e0220247.
https://doi.org/10.1371/journal.pone.0220247
Meuwissen,
T. H., Hayes, B. J., & Goddard, M. E. (2001). Prediction of total genetic
value using genome-wide dense marker maps. Genetics, 157(4),
1819–1829. https://doi.org/10.1093/genetics/157.4.1819
Moghaddar,
N., Swan, A. A., & Van Der Werf, J. H. J. (2014). Comparing genomic
prediction accuracy from purebred, crossbred and combined purebred and
crossbred reference populations in sheep. Genet Sel Evol, 46, 58.
https://doi.org/10.1186/s12711-014-0058-4
Munoz,
P. R., Resende, M. F. R., Huber, D. A., Quesada, T., Resende, M. D. V., Neale,
D. B., Wegrzyn, J. L., Kirst, M., & Peter, G. F. (2014). Genomic
Relationship Matrix for Correcting Pedigree Errors in Breeding Populations:
Impact on Genetic Parameters and Genomic Selection Accuracy. Crop Science,
54(3), 1115–1123. https://doi.org/10.2135/cropsci2012.12.0673
O’Neill,
C. J., Swain, D. L., & Kadarmideen, H. N. (2010). Evolutionary process of
Bos taurus cattle in favourable versus unfavourable environments and its
implications for genetic selection. Evolutionary Applications, 3(5–6),
422–433. https://doi.org/10.1111/j.1752-4571.2010.00151.x
Pérez-Enciso,
M., Forneris, N., de los Campos, G., & Legarra, A. (2017). Evaluating
Sequence-Based Genomic Prediction with an Efficient New Simulator. Genetics,
205(2), 939–953. https://doi.org/10.1534/genetics.116.194878
Pérez-Enciso,
M., Ramírez-Ayala, L. C., & Zingaretti, L. M. (2020). SeqBreed: a python
tool to evaluate genomic prediction in complex scenarios. Genetic Selection
Evolution, 52, 7. https://doi.org/10.1186/s12711-020-0530-2
Porto-Neto,
L. R., Reverter, A., Prayaga, K. C., Chan, E. K. F., Johnston, D. J., Hawken,
R. J., Fordyce, G., Garcia, J. F., Sonstegard, T. S., Bolormaa, S., Goddard, M.
E., Burrow, H. M., Henshall, J. M., Lehnert, S. A., & Barendse, W. (2014).
The Genetic Architecture of Climatic Adaptation of Tropical Cattle. PLoS ONE,
9(11), e113284. https://doi.org/10.1371/journal.pone.0113284
Purcell,
S., Neale, B., Todd-Brown, K., Thomas, L., Ferreira, M. A. R., Bender, D.,
Maller, J., Sklar, P., De Bakker, P. I. W., Daly, M. J., & Sham, P. C.
(2007). PLINK: A Tool Set for Whole-Genome Association and Population-Based
Linkage Analyses. American Journal of Human Genetics, 81(3),
559–575. https://doi.org/10.1086/519795
Ramírez
Ayala, L. C. (2024). Supplementary Table 1. QTL regions for each of these
three sets of phenotypes from the QTL database. figshare. Dataset. https://doi.org/10.6084/m9.figshare.27935052
Rendel,
J. (1974). The Role of Breeding and Genetics in Animal Production Improvement
in the Developing Countries. Genetics, 78(1), 563–575.
https://doi.org/10.1093/genetics/78.1.563
Rodriguez
Neira, J. D., Peripolli, E., de Negreiros, M. P. M., Espigolan, R.,
López-Correa, R., Aguilar, I., Lobo, R. B., & Baldi, F. (2022). Prediction
ability for growth and maternal traits using SNP arrays based on different
marker densities in Nellore cattle using the ssGBLUP. Journal of Applied
Genetics, 63(2), 389–400. https://doi.org/10.1007/s13353-022-00685-0
Rubio
Lozano, M. S., Ngapo, T. M., & Huerta-Leidenz, N. (2021). Tropical Beef: Is
There an Axiomatic Basis to Define the Concept? Foods, 10(5),
1025. https://doi.org/10.3390/foods10051025
Scheffler,
T. L. (2022). Connecting Heat Tolerance and Tenderness in Bos indicus
Influenced Cattle. Animals: An Open Access Journal from MDPI, 12(3),
220. https://doi.org/10.3390/ani12030220
Schutt,
K. M., Burrow, H. M., Thompson, J. M., & Bindon, B. M. (2009). Brahman and
Brahman crossbred cattle grown on pasture and in feedlots in subtropical and
temperate Australia. 1. Carcass quality. Animal Production Science, 49(6),
426–438. https://doi.org/10.1071/EA08081
Sinha,
D., Maurya, A. K., Abdi, G., Majeed, M., Agarwal, R., Mukherjee, R., Ganguly,
S., Aziz, R., Bhatia, M., Majgaonkar, A., Seal, S., Das, M., Banerjee, S.,
Chowdhury, S., Adeyemi, S. B., & Chen, J. T. (2023). Integrated Genomic
Selection for Accelerating Breeding Programs of Climate-Smart Cereals. Genes,
14(7), 1484. https://doi.org/10.3390/genes14071484
Strandén,
I., Kantanen, J., Russo, I. R. M., Orozco-terWengel, P., & Bruford, M. W.
(2019). Genomic selection strategies for breeding adaptation and production in
dairy cattle under climate change. Heredity, 123, 307–317.
https://doi.org/10.1038/s41437-019-0207-1
Su,
G., Guldbrandtsen, B., Gregersen, V. R., & Lund, M. S. (2010). Preliminary
investigation on reliability of genomic estimated breeding values in the Danish
Holstein population. Journal of Dairy Science, 93(3), 1175–1183.
https://doi.org/10.3168/jds.2009-2192
Utsunomiya,
Y. T., Milanesi, M., Fortes, M. R. S., Porto-Neto, L. R., Utsunomiya, A. T. H.,
Silva, M. V. G. B., Garcia, J. F., & Ajmone-Marsan, P. (2019). Genomic
clues of the evolutionary history of Bos indicus cattle. Animal Genetics,
50(6), 557–568. https://doi.org/10.1111/age.12836
VanRaden,
P. M. (2008). Efficient methods to compute genomic predictions. Journal of
Dairy Science, 91(11), 4414–4423.
https://doi.org/10.3168/jds.2007-0980
Ward,
J. A., McHugo, G. P., Dover, M. J., Hall, T. J., Ng’ang’a, S. I., Sonstegard,
T. S., Bradley, D. G., Frantz, L. A. F., Salter-Townshend, M., & MacHugh,
D. E. (2022). Genome-wide local ancestry and evidence for mitonuclear
coadaptation in African hybrid cattle populations. IScience, 25(7),
104672. https://doi.org/10.1016/j.isci.2022.104672
Watterson,
G. A. (1975). On the Number of Segregating Sites in Genetical Models without
Recombination. Theoretical Population Biology, 7 (2), 256–276. https://doi.org/10.1016/0040-5809(75)90020-9
SUPPLEMENTAL INFORMATION
Supplementary Table 1. QTL regions for each of
these three sets of phenotypes from the QTL database.
Tabla
suplementaria 1.
Regiones QTL para cada uno de los tres conjuntos de fenotipos de la base de
datos QTL.
Supplementary
data to this article can be found online at Ramírez Ayala, L. C. (2024). Supplementary
Table 1. QTL regions for each of these three sets of phenotypes from the QTL
database. figshare. Dataset. https://doi.org/10.6084/m9.figshare.27935052